I like this! So about 75% of the modules are 15% or less load at “average” conditions. And around 90% of modules are 25% or less. Those are good stats to keep in mind. Considering there are two cores, if you stick to this 90% and prefer the 75% group then you can run 8-12 modules at 48kHz. More if you can drop to 32k or 24k.
Obviously this is a gross oversimplification, since there are some must-try modules in that upper 10%, and there are also examples of patches running 30-40 or more modules… but having 8-12 is a helpful mental target when going about patch creation, especially for new users not familiar with the environment yet.
2 Likes
Dan,
Given we now have this cpu load database, would it be possible to code some kind of numerical display element in the 4ms Metamodule vcv plugin, that displayed the estimated likely CPU load (using the database as an embedded lookup table) of each users patch, prior to uploading? Would be really useful to keep track of things.
Yeah, something like that. I had promised it before the release, but the idea of a CPU load meter is feeling like less and less of a good idea the more data we collect on modules. Instead, something else might solve the need for a meter.
The problem with trying to distill CPU load estimates down to a single number (or even a min/max) is that I don’t see how to do it so that it’s both accurate and precise enough. An imprecise meter wouldn’t be useful (e.g. “This patch uses 10%-110% cpu”), and an inaccurate CPU meter would just cause frustration and confusion (e.g. “This patch will run at 75%” – but actually it overloads).
Looking at the spreadsheet as it exists now, the average spread between min and max cpu usage for a module at 512 block size is about 4%. A 12 module patch gives us an average of a 48% spread, e.g. “This patch uses 60% - 108%”. I tested some real-world patches and that’s about what an imaginary CPU meter would report. It would also need to be reported that this might be completely inaccurate because of knob positions or internal states/modes.
If I were making a patch in VCV and saw 60-108% with an asterisk that it might even be substantially higher or lower, I don’t think I’d find that very useful. On the other hand, if I added a new module and saw it jump to 80-128%, then that difference of 20% would be useful to know – and that’s making us re-think the whole idea of a CPU meter.
What we need is a solution that provides some information about the patch and about potential modules, but does not give a false sense of hope/doom. Something that encourages users to experiment but also provides some guidance in making choices about which modules to use.
Perhaps: instead of a meter with one number (or a min/max), we could have a link to a web page or a pop-up window that lets you filter and find modules based on function/tag and see their CPU load numbers. Maybe it can list the load numbers for the modules in your patch and provide a subtotal for each column of the spreadsheet. This is more attractive especially after seeing @gabrielroth’s work on the tag website. That would at least solve the issue of “I’m at 80% and I need an LFO, what are the options?”, but wouldn’t be misleading since you’d be presented with the raw data and forced to reckon with the fact that CPU usage is inherently complicated.
On that topic (complexity), here are a few things making it hard to distill cpu usage of a patch down to one or two useful numbers. Apologies in advance for the long-rant style!
- If you scroll through the CPU load spreadsheet, most modules are fairly constant in their usage for a given block size. But about 1 in 6 modules shoot up at least 5% when you patch jacks.
- Similarly, some modules change drastically depending on the knob positions. E.g. some oscillators go up in CPU usage as the freq goes up. Measuring various knob positions would turn this into a big-data project (even just 6 knobs at a few positions and 6 jacks requires > 100k measurements for a single module). The spreadsheet only represents each module with all knobs/params at 25% since this is such a big deal to measure all the knobs at various positions.
- Some modules have very different cpu usages depending on an internal state. E.g. right-click menu selects the algorithm/mode, or a button selects oversampling amount. Or you have to load a wavetable or sample file. For some modules this is the difference between a cool 10% load and >100% overloading. I don’t have any data about which modules or how many modules are like this. I’m not even sure how to do that programmatically.
TY, I did not have an appreciation of all that. Perhaps we could define CPU Load as an art. Elastika high on idle, and lower under load does not look like science I understand.
Perhaps a simple color code system that shows max usage as low-med-high. That would at least give you an idea of the CPU impact of a module.
Yes this is of help, are you sharing the sheet somewhere?
We just made a new page on our site, which combines the CPU load database with a list of modules/plugins and tags for each module.
It’s based on @gabrielroth’s Module Finder.
https://metamodule.info/modulefinder
I won’t be updating the CPU database on this thread anymore, as all new data will just go right to that page.
2 Likes
ty much for all the hardwork with both 2.0 and modular finder!!
just noticing:
Seaside Modular Tala 101573 – 101697%
don’t think i’ll be using that module haha, lest it melt my mm!
2 Likes
Ha ha. Yeah that one takes a long time to load the module, but then once it’s loaded it runs fine. The automatic CPU tester rolls the load time in.
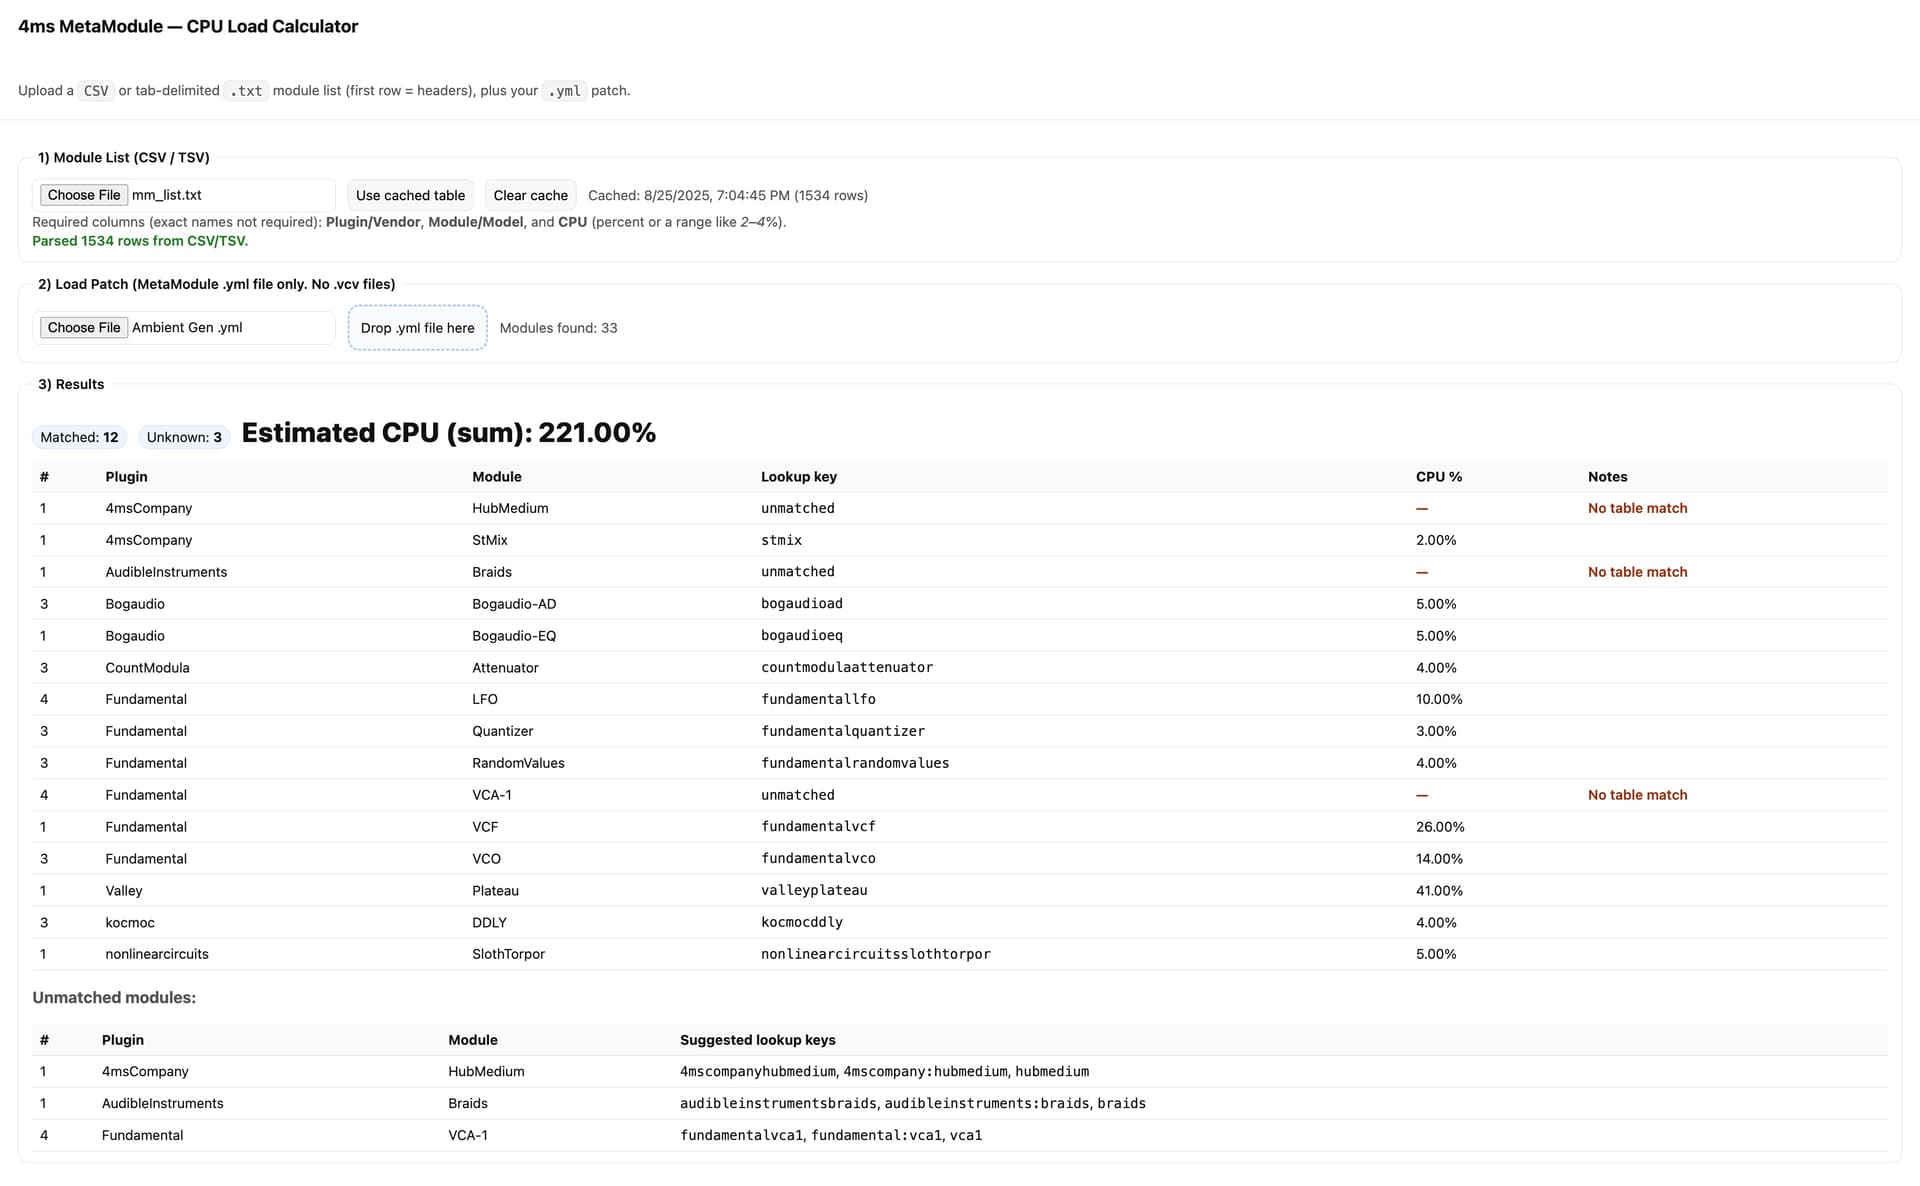
I think my addition to this thread may be pedestrian, but it is borne out of need and this seems the place to post it. I created a stand alone web page included here that will parse the .yml I am about to load onto MM and give me an idea of how realistic my patch is for running on MM. It requires a .txt (tab delimited) or .csv of the modules listed on the Module Finder page. I made the included .txt file by hand (if cutting and pasting into Numbers is ‘by-hand’). It then allows you to load a .yml file (thanks for not using compressed XML!) and calculates an estimated CPU percentage. Right now it uses the most pessimistic scenario (the largest amount of CPU). But I see here there is a more detailed file that could be used to estimate percentages at different sample sizes. Is this file being kept up to date? Which columns are the min-max estimated percentages coming from? And if the startup memory footprint columns impact whether the patch can even get a start, how much memory does MM have? I am considering adding a “Likely to run:No/Low/Moderate/High”. If the memory footprint at startup impacts this, how much memory does MM have and what would be the threshold?
hum. it appears I’m not allowed to upload a .txt, .csv or .html/htm. Sorry I will have to find another way of sharing. Here’s a screenshot as a substitute.
.maury
(not really Igor Stravinsky)
Cool! I added txt and html extensions for attachments. See if that works now.
Yes, the CPU load tests are run with each new firmware version (and sometimes manually when there’s a new plugin), and it generates a CSV file. The ModuleFinder is just reading from that CSV file. I think I could expose the latest version of this CSV file without a problem, here it is:
https://metamodule.info/dl/cpu_test.csv
For the selected block size, it’s the minimum and maximum values for that module.
Memory is more tricky because modules might allocate memory when you, for example, load a sample. So it’s not an easy one to say “This patch will load” or not without knowing the details of a module and the wav files a user intends to load. There’s around 300MB of memory available for modules and patches (which includes plugins).
Thanks Dan.
here are the files. The web page uses indexdb to cache so it can be used offline too.
I’ll work on updating the code to be more sophisticated by using the CPU metrics.
I am working under the assumption that there is up to 200% CPU available on MM? And given a typical multicore, 166% realistically? This does not translate to what I see on MM as it only shows up to 100%.
mm_list.txt (42.6 KB)
metamodule_cpo_load_calculator.html (17.8 KB)
b.t.w., it is challenging to match up names. Even with regex. It seems that in the VCV world, how you name something is the wild wild west.
So, multi-core makes the math a little more complex…
The modules in the patch are split into two groups, and the MM engine attempts to make the groups as equal as possible (in terms of CPU load). Both cores are run at the same time, in parallel. The percentage at the top of the screen is calculated from the total time it takes to run both cores. So essentially it’s reporting the load of the core with the highest % load (although technically it’s a bit more complex than that because there are things like inter-core cables and core synchronization…)
For example: if you had six modules that were all 20% each, then each core would run 3 of the modules. So the actual load (reported at the top of the MM screen) would be 3 x 20 = 60%.
But if you added a 7th module that uses 50%, then the MM engine would run 4 of the 20% modules on one core (total load 80%), and 2 of the 20% modules plus the 50% module on the other core (total 2 x 20% + 50% = 90%). So the reported load would be 90%.
As a shortcut estimate, you could just take the sum of all the module loads and divide by 2. So in the 6 x 20% example, you would correctly get 120%/2 = 60%. In the second example, you would get 170%/2 = 85% which is close to the actual 90%.
This is a big oversimplification because the number of cables, and MIDI and knob mappings affects the load, too. But it’s probably still useful.
Reporting the min and max might be helpful to do on the html page. Some modules have a huge range (e.g. I just tested with a patch with OrangeLine DejaVu: 16-70%).
All patches have the 4msCompany:HubMedium module, which is a stand-in for the panel mappings. So you can just ignore that.
Yeah, there are “slug” and display name. Also there can be a brand name that’s different than the display name or slug.
This yml file has all the information needed to matching them. Probably would need to parse the yaml and then find the right key and lookup the associated names.
It’s kept up to date in order to support another script:
https://metamodule.info/dl/plugins.yml
If this is their Marbles and the other Marbles from other developers have a smaller footprint, maybe this needs some profiling by the other developers. I’ll know to avoid that module!
It’s not based on Marbles. It does something unique.
This looks helpful. I won’t have to go into all the modules and convert them to yaml. Thanks.
I’ve not used AirWindows yet, but I see all of its modes are elevated to the same level as a separate module? But when I look at it is simply one racked module. Does that pattern repeat for other modules that have multiple modes?
Right, each of the sub-modules in the VCV version are a unique module in MetaModule. Airwindows is the only module like that.
The MM Hub module in VCV knows about Airwindows and how to translate between the VCV and MM versions. So the patch yml file that the Hub generates contains the MM version. Also the Module Finder has all the Airwindows modules shown as the MM versions, so the html file shouldn’t have a problem parsing that.
Thanks again and here is the calculator with refreshed features. It now can load the .csv file of performance metrics, the plugins.yml and then the patch.yml your estimating run-ability.
metamodule_cpo_load_calculator_ß2.html (28.3 KB)
I’ve been using the patch ‘AmbientGen.yml’. AmbientGen just barely runs on my MM and I have to slow down to 24. When I look at the results from this calculator, the thresholds I’ve set say it won’t run at all and memory is blown out. I don’t think this measures up with the reality of how the CPU handles the load and memory (which expands and contracts). I imagine the percentages are from test harnesses and not necessarily what run time looks like.